
Solar Monitor Project
Background: Each year when we see generators on sale at Costco we say to ourselves “This is probably the year that we’ll have a big ice storm and regret not buying a generator…” but then we think twice about spending a few hundred dollars and the thought passes.
A few months back we were having the same sort of thoughts when I happened on an article about the cost of residential solar power installations continuing to drop over time. One web link led me to another and I soon saw that the tax credits for residential solar installations (35% up to $10.5K in NC & 30% no max Federal) would be expiring at the end of 2015 (NC) and 2016 (Fed). (Some good info here: Solar Tax Incentives) We get a lot of good North Carolina sun on our roof and it got me to thinking about whether it would be a worthwhile investment to try to put in a solar system that could both offset our current electric expense but also provide some backup in the event of a power outage (Grid Inter-tied Residential Solar Power System with Battery Backup) See here: Residential Solar System Types
We’re fairly lucky in that our electric use is fairly constant and rates are not too bad in our area. We manage it fairly well (time of use discounts, programmable thermostats and water heater timer, etc.) but we still run around $180 per month on average. Thinking 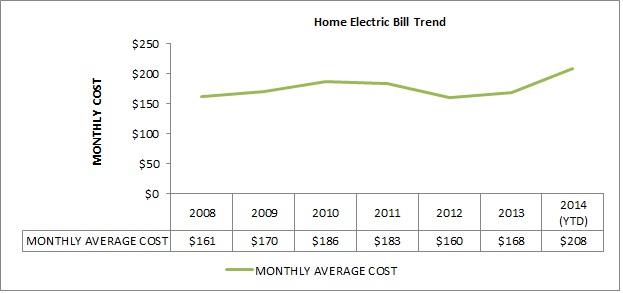 about overall pay-back time horizons I just started with the concept of halving the current electric bill. At this point I don’t really know if that is reasonable or complete pie-in-the-sky but saving $90 per month on the electric bill would roughly be $1000 savings per year so in 10-15 years we could get payback on a fairly hefty investment (accounting for the tax credits of course also!) Here is some additional data that I’m able to get from our power company (Duke Energy):
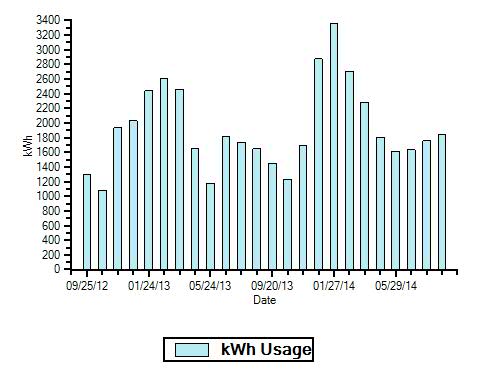
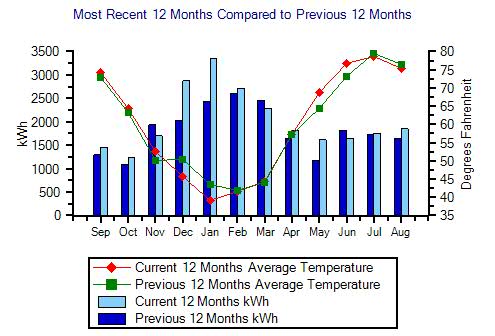 I also found some useful info here that indicates we receive ~111 “full sunny” days per year with ~217 days per year that are at least partially sunny (>40%). Once I get to the point of trying to analyze and size a potential system this will be helpful data also!
Problem: Could I figure out a way to determine if this sort of system would really pay for itself in a reasonable amount of time (ie maybe 10 years or so). In other words, on average how efficient would a panel be at our house based on the amount of sun, orientation of the roof, typical weather, etc? If I had data like that then I could look at our power needs (max kilowatt usage from our electric bill in a typical year) and determine if I could put in a system to meet that need without completely breaking the bank (or having to put in more roof!)
A Project is Born: A few other ideas had been bouncing around in my head that all fit nicely around this problem:
- Find a real use for the Raspberry Pi I had bought a few months back just to tinker with it. If you’re not familiar with this take a quick look here: Raspberry Pi This thing is pretty amazing considering it’s a $35 investment – you have to love their teaching mission also.
- I had been wanting to learn to code in Python. I’ve learned Perl and PHP in the last 10 years or so but haven’t gotten any experience with the newer languages yet.
- The “Internet of Things” and home automation both seem to be poised to explode – every time I read an article about these topics I then wind up wasting time following countless other related links. Lots to learn and a big future in this space I think.
Solution Components:
- Raspberry Pi Linux Server: I already owned one of these and knew it could function as the “brains” of the project – storing the data and providing a web-interface to view it.
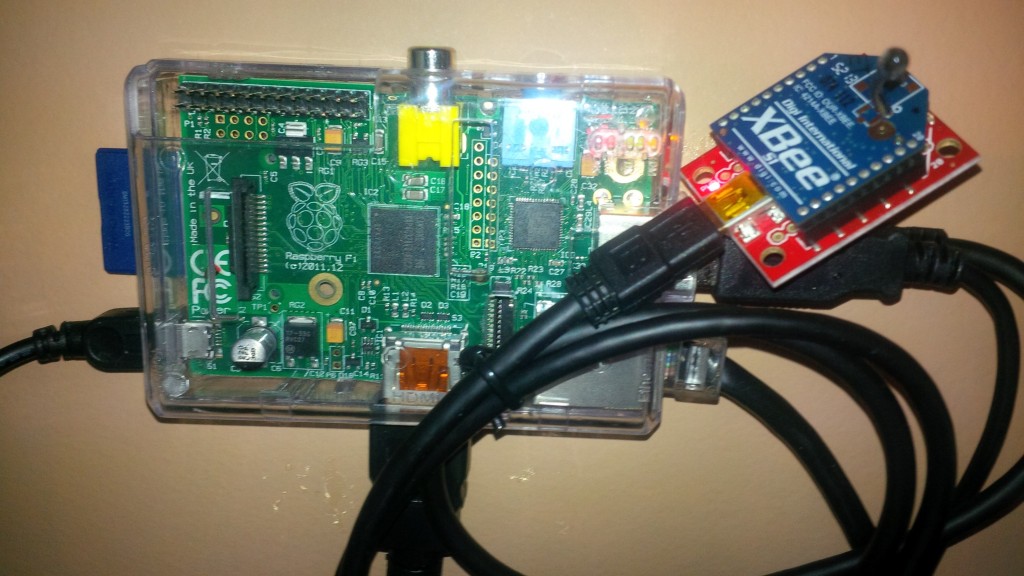
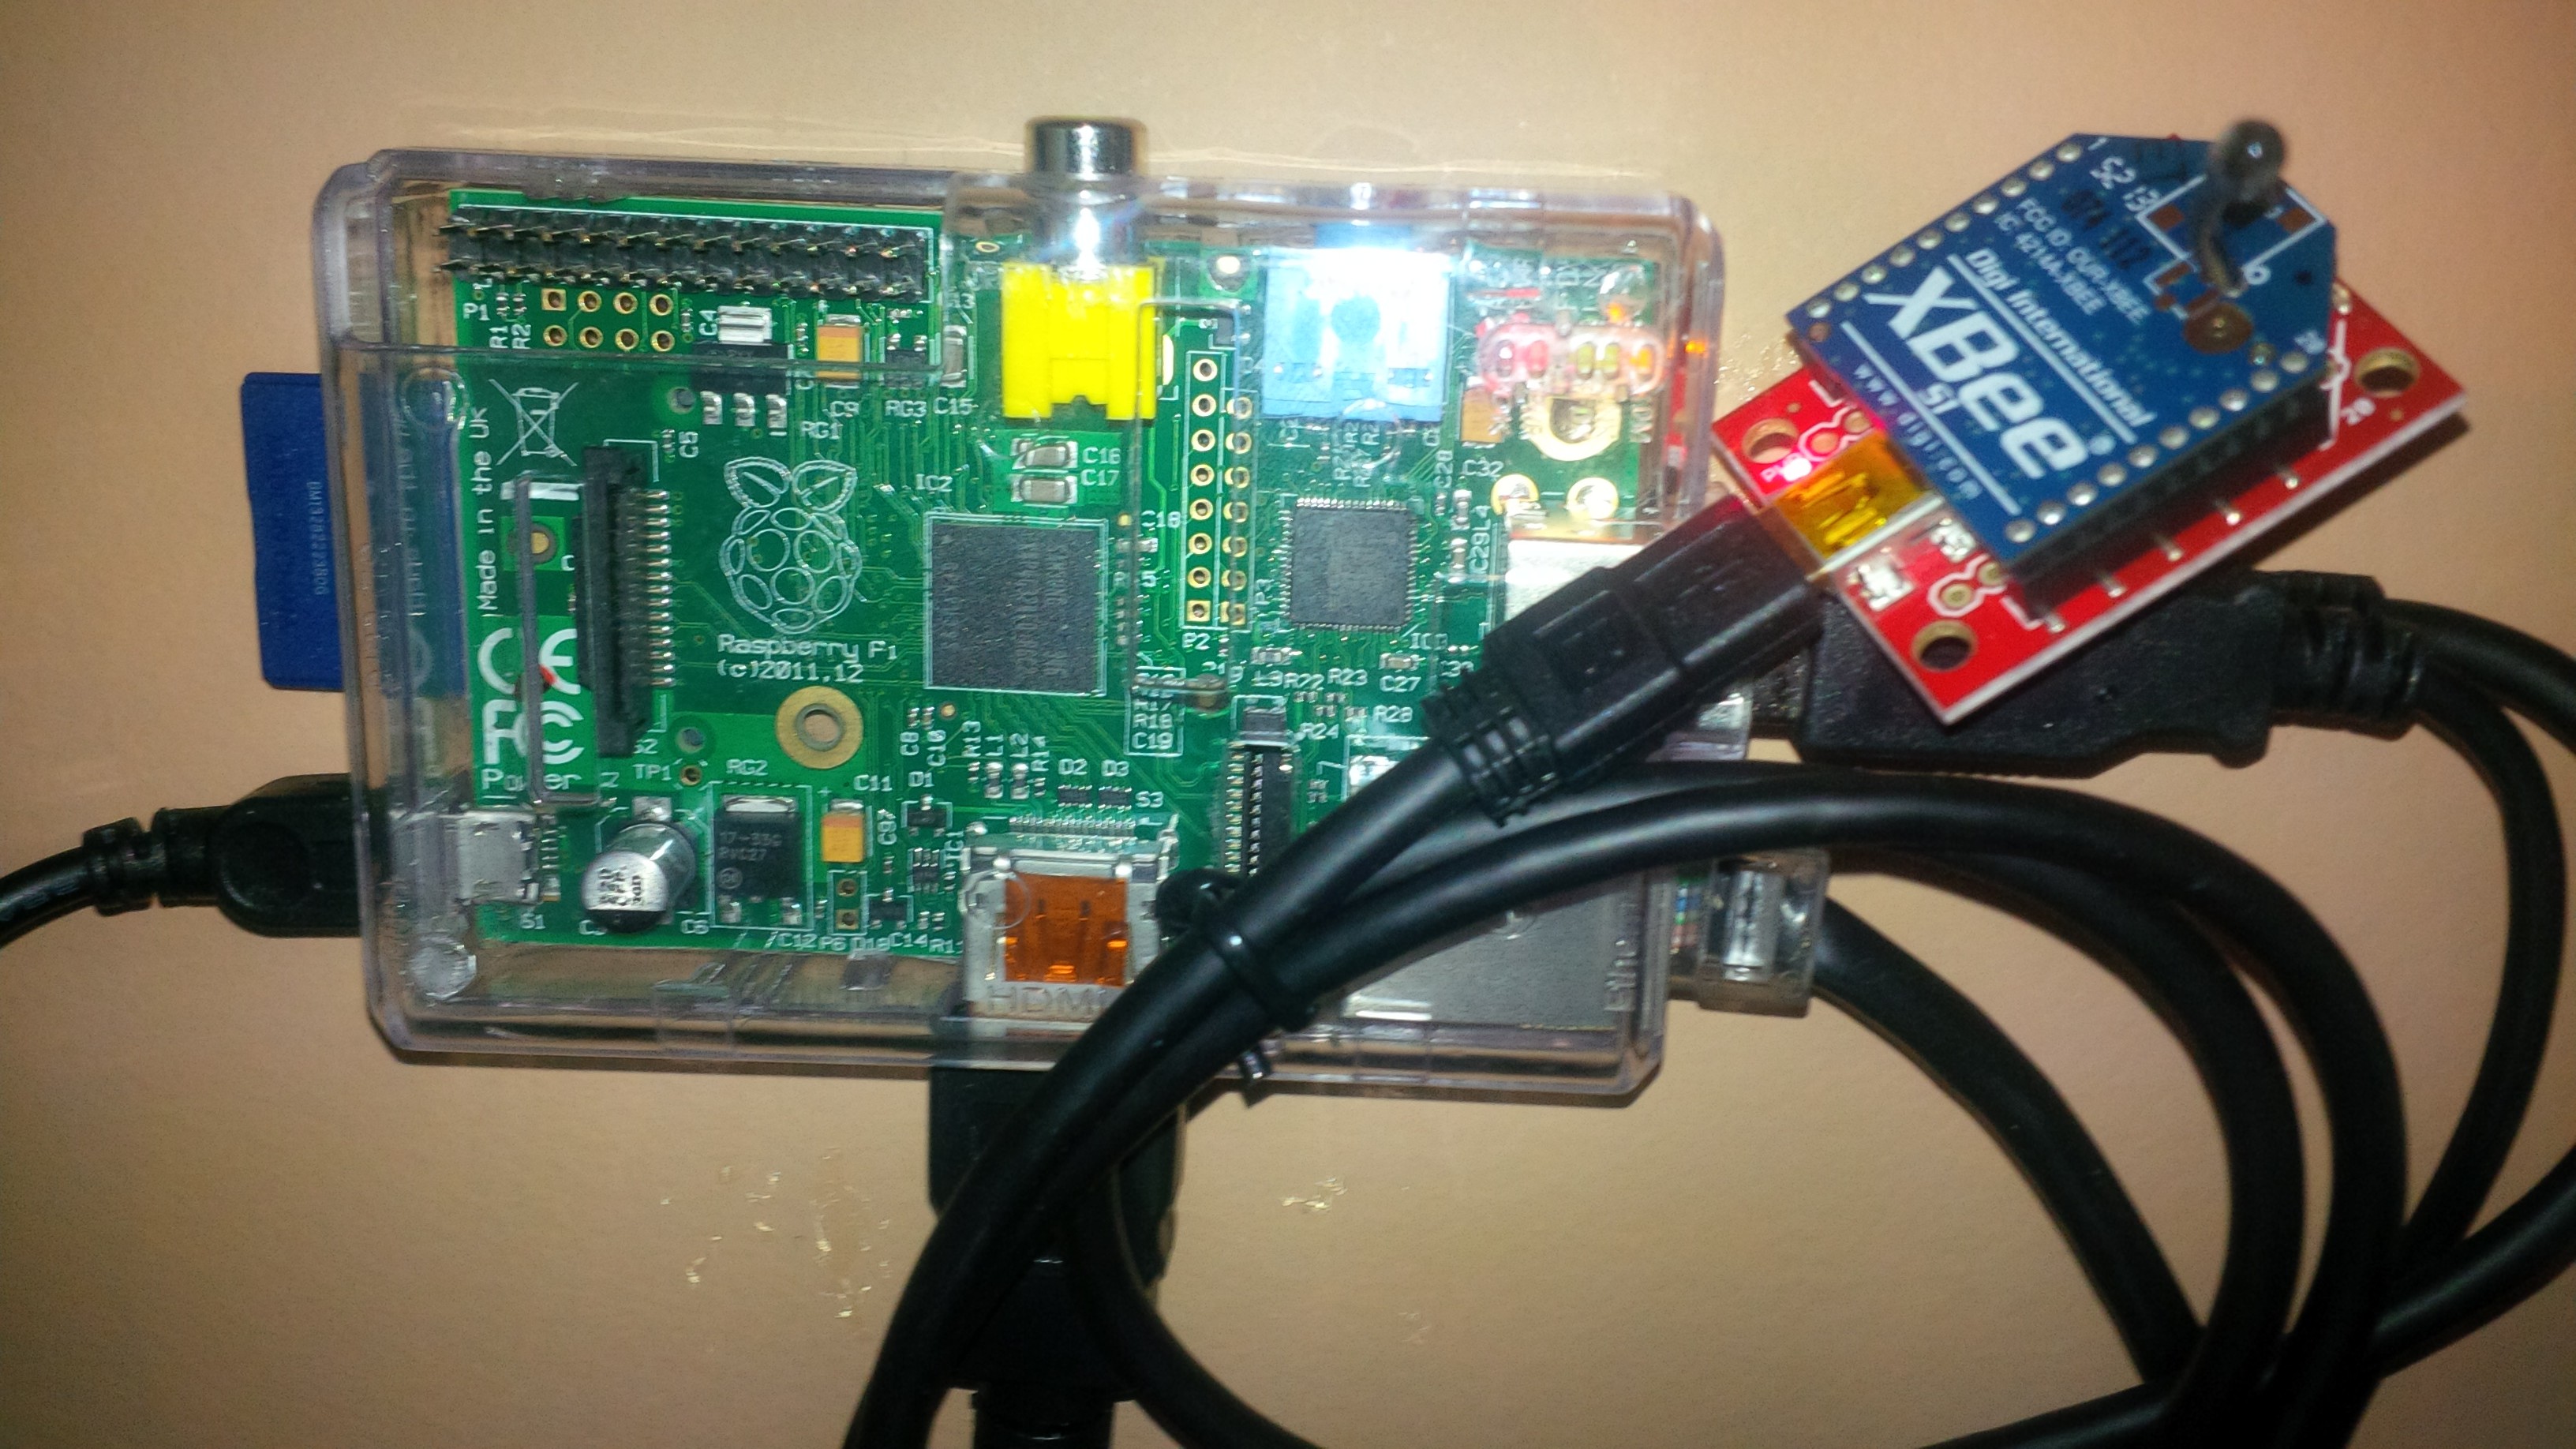
The Raspberry Pi Server velcro’d to the wall next to my desk with an XBEE radio connected to it via USB cable. For scale, note the XBEE is about the size of a quarter. The other connections are power and SD card on the left, HDMI monitor on the bottom, ethernet on the lower right, and a second USB under the XBEE which connects to a USB hub that has keyboard, mouse and external hard drive! There are also an audio and RCA video port on the top but I’m not currently using them – quite a gadget!
- XBEE Radios: – as I googled around looking for ideas on how to remotely monitor a solar panel I found a lot of info that mentioned these devices (What is an XBEE?) and quickly realized that they were ideal for the job. They communicate via radio frequency over short distances using the 802.15.4 protocol and with a number of pins for analog and digital input/output they can be adapted to lots of uses. Here are some good examples: http://gallery.digi.com/category/xbee-projects/
- Analog Sensors: In addition to measuring the solar panel efficiency I also found some inexpensive sensors that would let me measure some other variables at the same time:
- Temperature – http://www.adafruit.com/products/165
- Light Sensor – http://www.adafruit.com/products/1384
- Solar Panel (Voltage/Watts) – http://amzn.com/B00CBT8A14
At this point I was ready to start buying stuff (being an Amazon Prime member can get a bit dangerous at times!)
Parts List:
| ITEM | DESCRIPTION | COST | PIC |
| Total cost = $183 | |||
| Raspberry Pi | Credit-card sized linux server that runs Apache and MySQL and hosts the various php and python code files – I already had this but decided to consider the cost within this project | $35 |  |
| XBEE Radio | These are the little wireless gadgets that enable the transmission of data collected from various sensors connected to its pins. I needed 2 – 1 connects to the Raspberry Pi sever so it can receive data from the other remote unit | qty 2 @ $29 each |  |
| XBEE Shield | This isn’t necessarily required but made life a lot easier (saves soldering and handles the power mgmt on the board) | qty 2 @$19 each |  |
| 5V Solar Panel | This will be the stand-in for a full blown system and used to try to determine how efficient an installation at our house might be. This is pretty bare bones (I had to solder leads on to the back of it) but its specs say it generates 5V at 500milliamps (ie in theory a 2.5 watt panel) I measured it with my multimeter and see it generating ~5.4 volts and ~95 milliamps under full direct sunlight. This calculates to~.5watts which would mean it’s about 20% efficient and that seems right in line with what I believe should be expected | $9 | 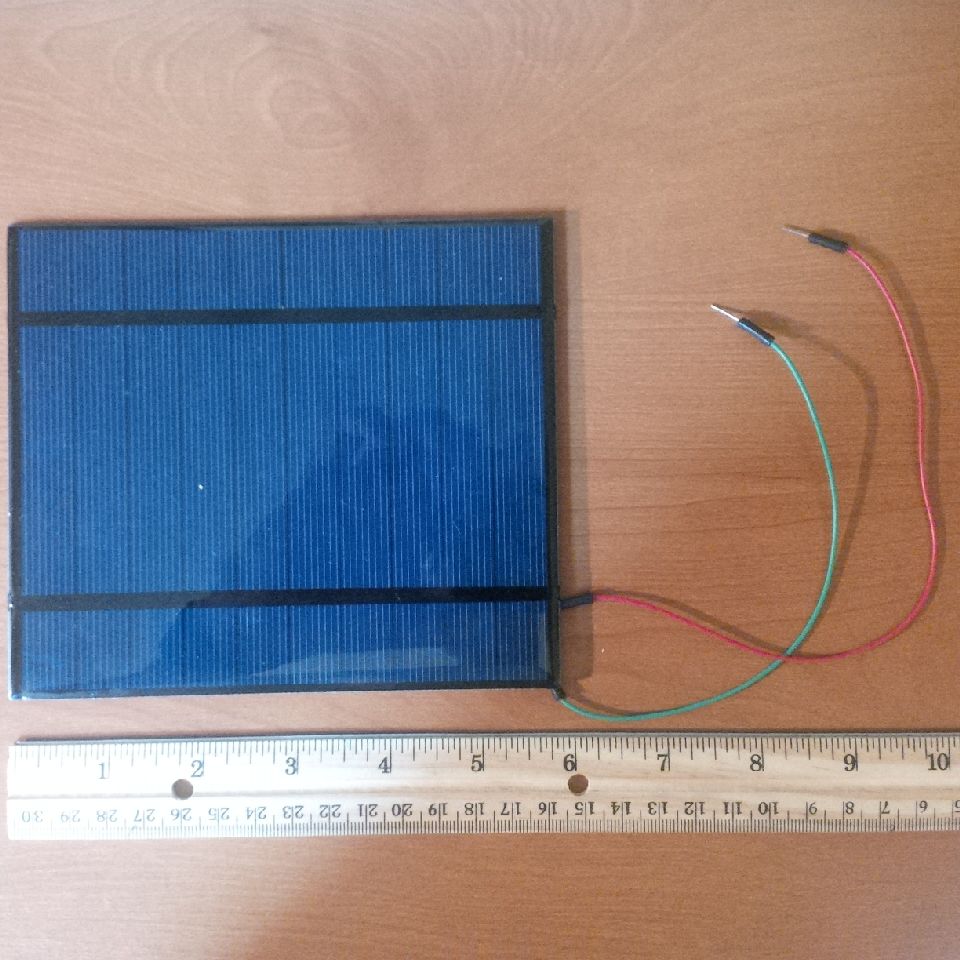 |
| TMP35 Analog temperature sensor | This will let me check the ambient temp near the panel and then collect data that can be graphed to check the relationship between temp and production/efficiency on the panel | $2 | 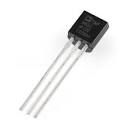 |
| Analog Light Sensor | With this I can measure the “lux” hitting the panel and thus add a measure of how “sunny” it is in relation to panel performance | $6 | 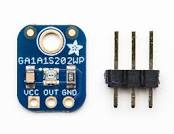 |
| Electronics Parts Kit | Needed a breadboard and some jumper wires and I figured that no matter what I bought I would break something or need more so I bought a kit | $16 | 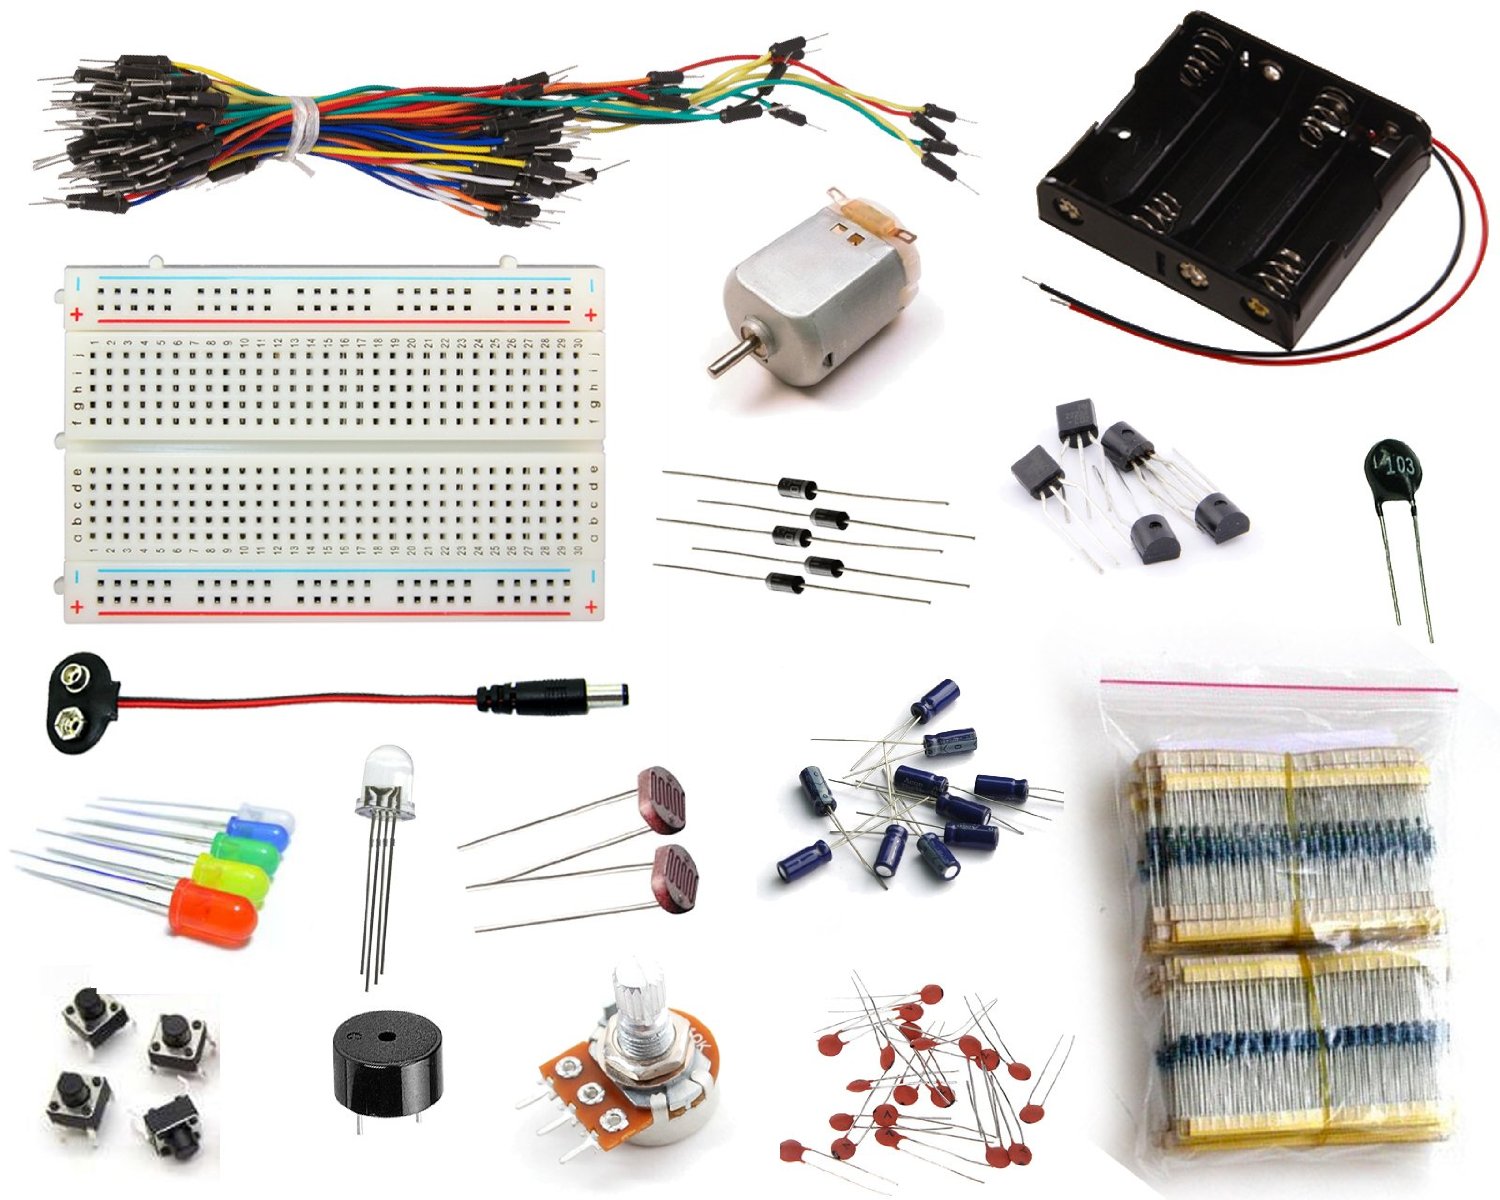 |
| 5V Regulator | The XBEE shield takes 5volts in (and regulates that down to 3.3volts). I use this to take the 9v battery down to 5v to power the whole mess | $6 | 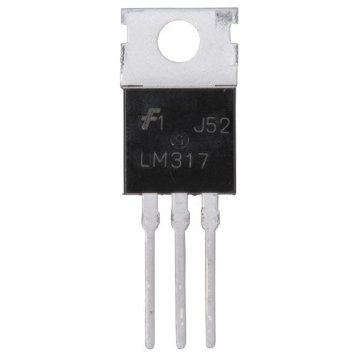 |
| 9V Rechargeable Battery | Probably could have done this without a rechargeable but it makes the whole thing self-sustaining as the solar panel can recharge the battery | $9 |  |
| 9V Battery Holder | Didn’t really need this but it made things cleaner! | $4 |  |
| Enclosure | Not sure what this will turn out to be yet – perhaps a recycled plastic case as in the garage monitor project but might also need something a bit more weatherproof and with the ability to mount and change the angle of the solar panel – so TBD for now! | $0 |
Of course if I actually wind up installing a solar system and saving money on the electric bill then I’ll include this $183 in the payback calculation! 🙂
Putting It All Together:
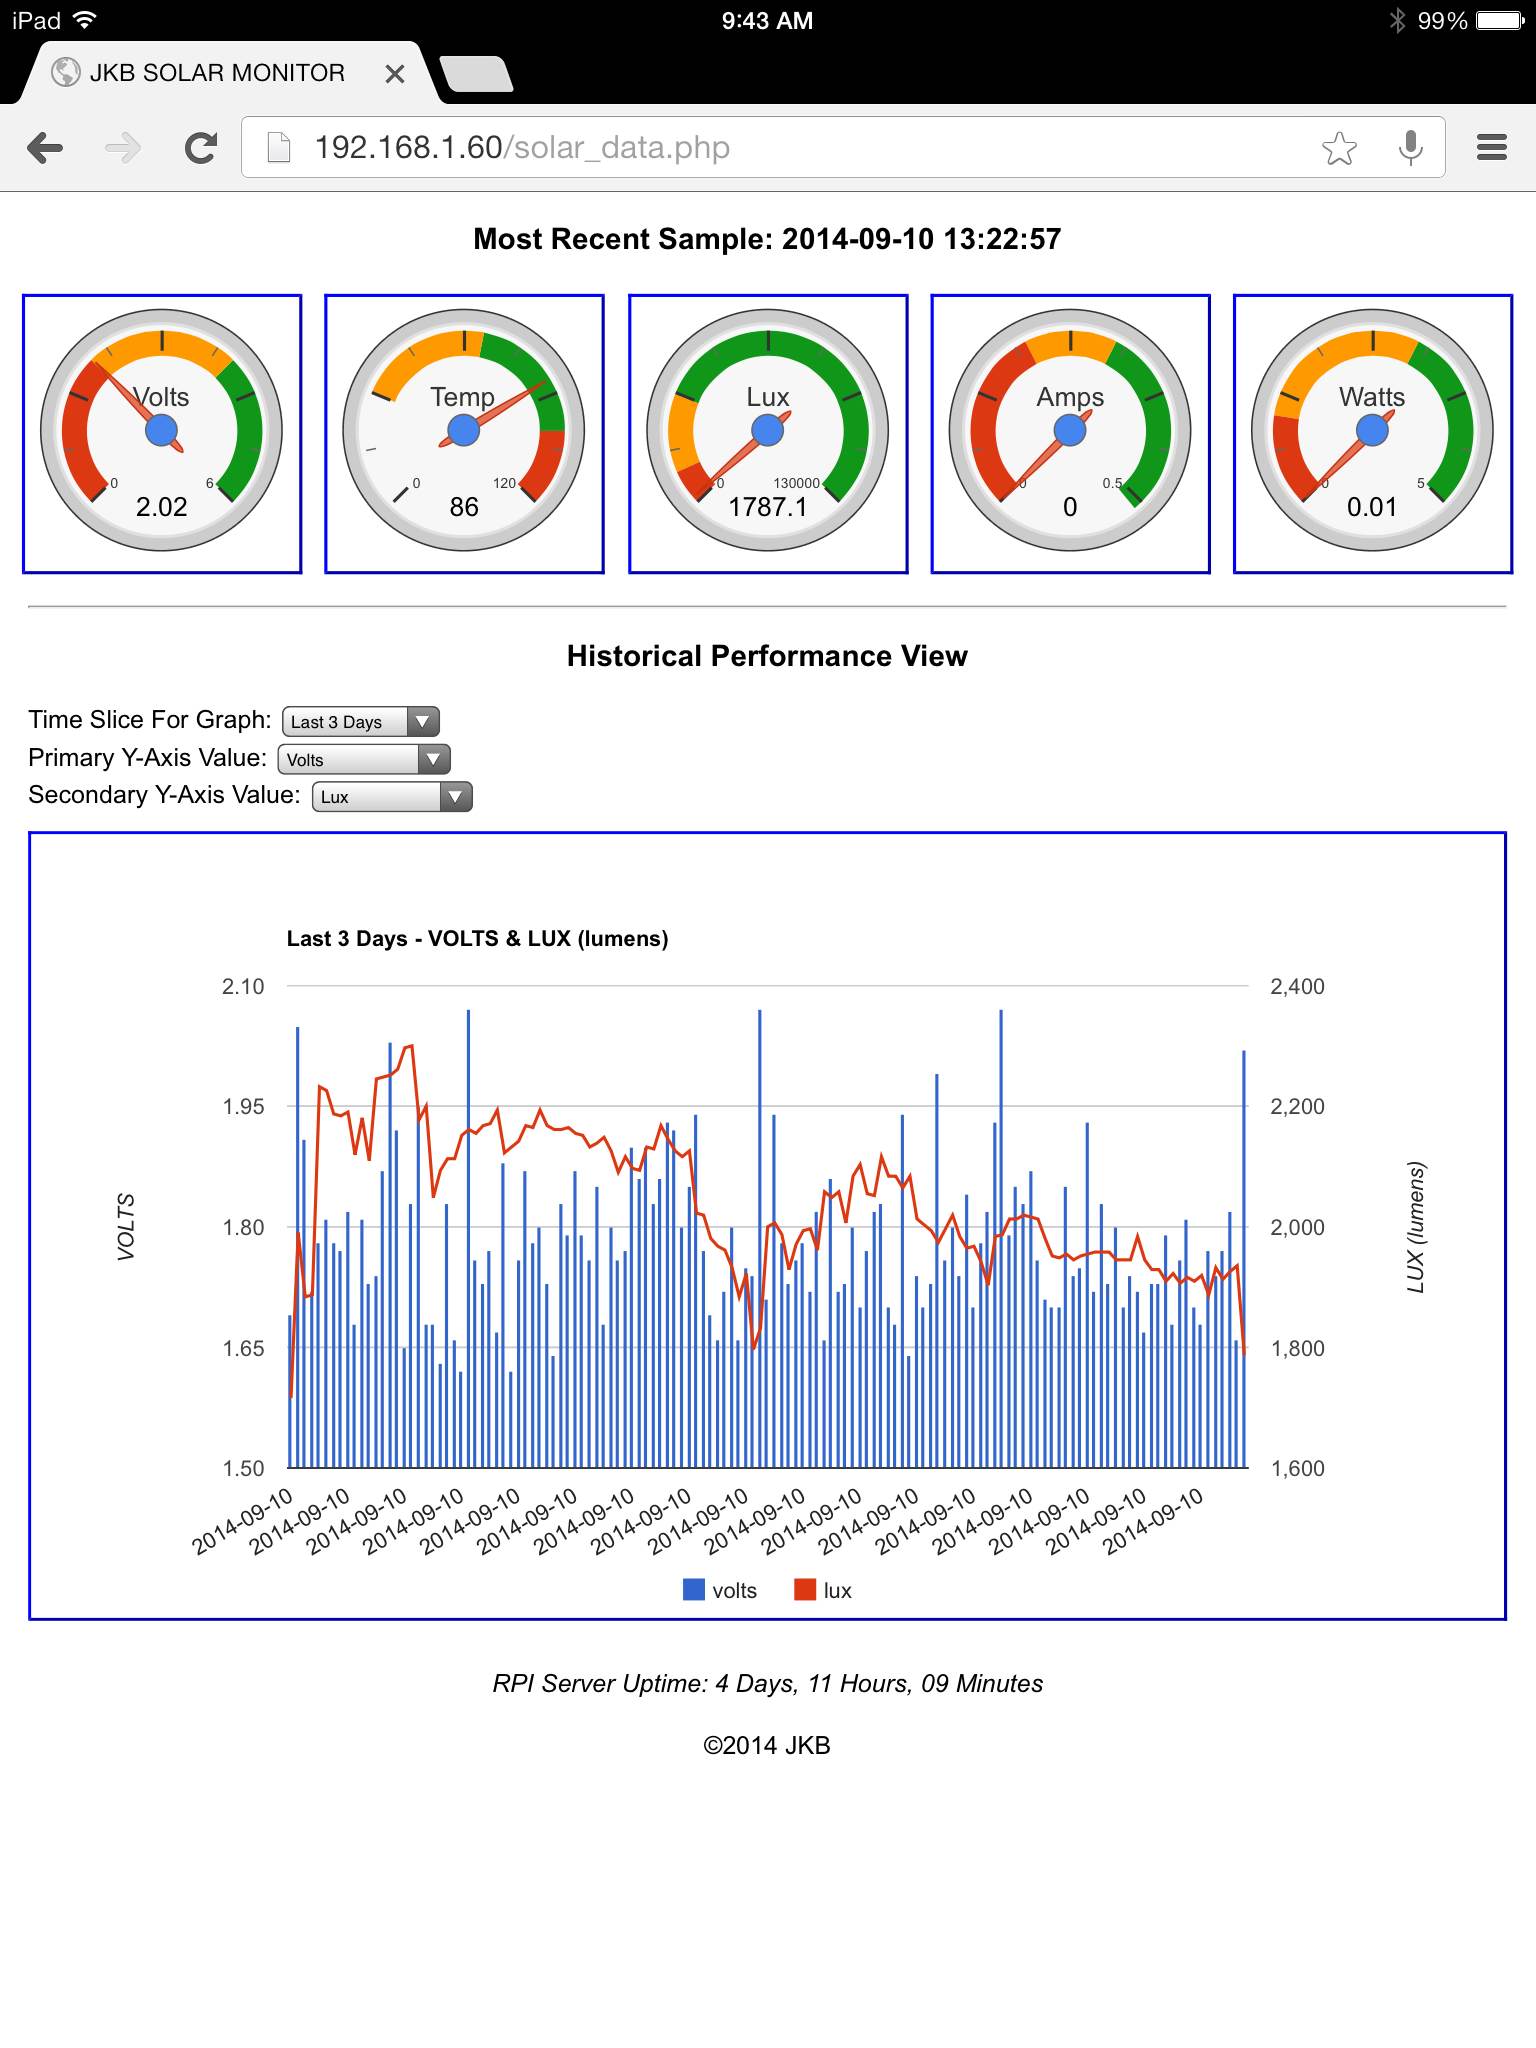
- Web code: I took a somewhat backwards approach – since I had experience with writing database and web code I decided to build all that first. I populated a MySQL database running on the Raspberry Pi with dummy data and built out the web code in PHP to display it easily through the Apache web server also running on the Pi. When looking around for how to easily graph the data I came upon Google Visualizations and had a lot of fun learning how to leverage it. Here’s a look at the current web page view. This will likely continue to evolve but for now it’s a simple view of the latest reading (the 3 gauges at the top) plus an interactive histogram graph that lets you plot production of the panel over various time slices against either temperature or light:
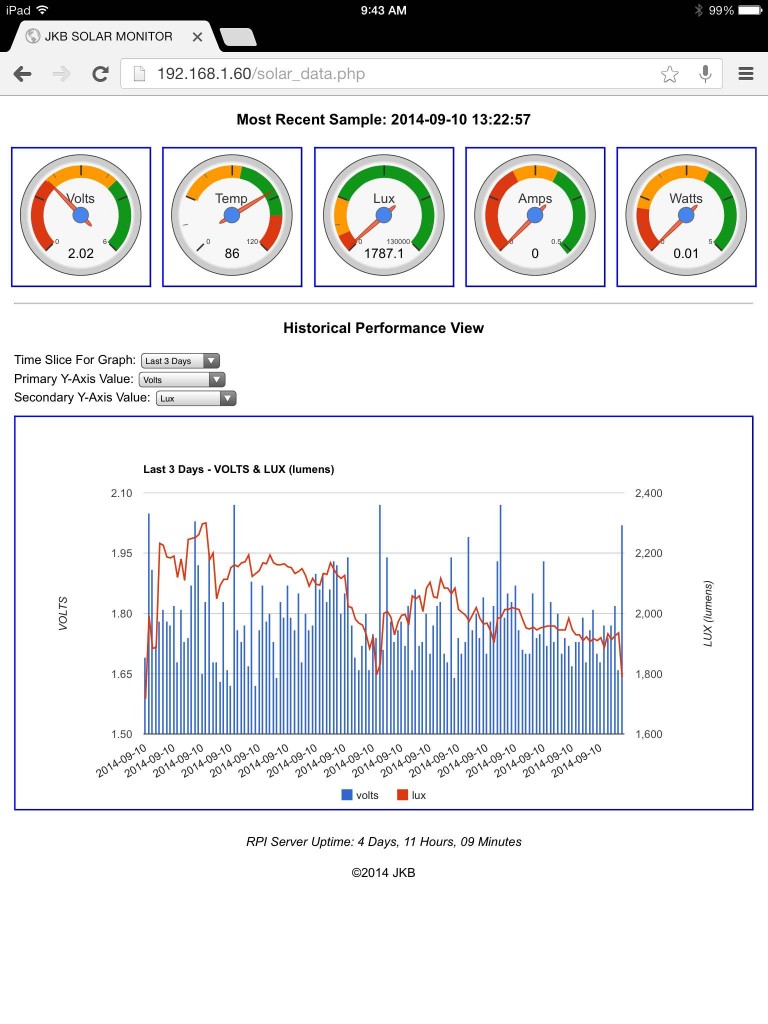
Dynamic web page that pulls the captured data from the MySQL database on the Raspberry Pi server and then uses Google Visualizations to graph it. Note that the histogram chart at the bottom has a pick-list box to allow the viewer to easily change the time slice on the x-axis or the secondary y-axis from temp to lux. This is currently running on the local Apache web server and only available from my local home private network.
The PHP web code for displaying the data stored in the MySQL database:
123456789101112131415161718192021222324252627282930313233343536373839404142434445464748495051525354555657585960616263646566676869707172737475767778798081828384858687888990919293949596979899100101102103104105106107108109110111112113114115116117118119120121122123124125126127128129130131132133134135136137138139140141142143144145146147148149150151152153154155156157158159160161162163164165166167168169170171172173174175176177178179180181182183184185186187188189190191192193194195196197198199200201202203204205206207208209210211212213214215216217218219220221222223224225226227228229230231232233234235236237238239240241242243244245246247248249250251252253254255256257258259260261<!DOCTYPE html PUBLIC "-//W3C//DTD XHTML 1.0 Strict//EN" "http://www.w3.org/TR/xhtml1/DTD/xhtml1-strict.dtd"><html xmlns="http://www.w3.org/1999/xhtml"><head><meta http-equiv="content-type" content="text/html; charset=utf-8"/><!-- Load the JSAPI, AJAX & Google modules --><script type="text/javascript" src="http://www.google.com/jsapi"></script><script type="text/javascript" src="//ajax.googleapis.com/ajax/libs/jquery/1.11.1/jquery.min.js"></script><script type="text/javascript">google.load('visualization', '1', {packages: ['gauge','corechart','table']});</script><title>JKB SOLAR MONITOR</title><!-- CSS for controlling fromatting of various components of the page --><style type="text/css">div#container { display:flex; justify-content: center; }div#gauge, div#gauge2, div#gauge3 {float: left;border: 2px outset blue;margin: 5px;}div#graph_form {clear: both; margin: 10px;}div#chart_div {clear: both; margin: 10px;}</style><!-- PHP code to access the local MYSQL db and pull the most recent record/data sample from the SOLAR_DATA database --><?php$dbhost = 'localhost:3036';$dbuser = 'xxxx';$dbpass = 'xxxx';$conn = mysql_connect($dbhost, $dbuser, $dbpass);if(! $conn ){die('Could not connect: ' . mysql_error());}$sql = 'SELECT timestamp, volts, ambient_temp, luxFROM PANEL_DATA ORDER BY timestamp DESC LIMIT 1';mysql_select_db('SOLAR_DATA');$retval = mysql_query( $sql, $conn );if(! $retval ){die('Could not get data: ' . mysql_error());}$row = mysql_fetch_row($retval);print "<H3><center>Current Sample: ".$row[0]." </H3>";// Old print statement also had "<I><center>Latitude = 35.605939 Longitude = -78.858386</I></center>" ...$volts = $row[1];$ambient_temp = $row[2];$lux = $row[3];?><!-- JavaScript to generate the fuel gauge charts with Google Visualizations --><script type="text/javascript">function drawVisualization() {// Create and populate the data table for the VOLTS gauge.var data = google.visualization.arrayToDataTable([['Label', 'Value'],['Volts', <?php echo $volts; ?>]]);var options = {width: 300, height: 300,redFrom: 0, redTo: 2,yellowFrom: 2, yellowTo: 4,greenFrom: 4, greenTo: 6,minorticks: 1,max: 6};// Create and draw the visualization.new google.visualization.Gauge(document.getElementById('gauge')).draw(data, options);}google.setOnLoadCallback(drawVisualization);function drawgauge2() {// Create and populate the data table for the TEMP gauge.var datag2 = google.visualization.arrayToDataTable([['Label', 'Value'],['Temp', <?php echo $ambient_temp; ?>]]);var optionsg2 = {width: 300, height: 300,redFrom: 100, redTo: 120,yellowFrom: 30, yellowTo: 65,greenFrom: 65, greenTo: 100,minorticks: 5,max: 120};// Create and draw the visualization.new google.visualization.Gauge(document.getElementById('gauge2')).draw(datag2, optionsg2);}google.setOnLoadCallback(drawgauge2);function drawgauge3() {// Create and populate the data table for the LUX gauge.var datag3 = google.visualization.arrayToDataTable([['Label', 'Value'],['Lux', <?php echo $lux; ?>]]);var optionsg3 = {width: 300, height: 300,redFrom: 0, redTo: 10000,yellowFrom: 10000, yellowTo: 32000,greenFrom: 32000, greenTo: 130000,minorticks: 2500,max: 130000};// Create and draw the visualization.new google.visualization.Gauge(document.getElementById('gauge3')).draw(datag3, optionsg3);}google.setOnLoadCallback(drawgauge3);</script><!-- older code for a 3-day line chart graph - all commented out as not longer used...<script type="text/javascript" src="//www.google.com/jsapi"></script><script type="text/javascript">google.load('visualization', '1', {packages: ['corechart']});</script><script type="text/javascript">function drawVisualization2() {// Create and populate the data table.var data = google.visualization.arrayToDataTable([['x', 'VOLTS'],--><?php//$graph_num_days = 3;//$sql2 = 'SELECT timestamp, volts// FROM PANEL_DATA WHERE DATEDIFF(NOW(),timestamp) < '.$graph_num_days;//mysql_select_db('SOLAR_DATA');//$retval2 = mysql_query( $sql2, $conn );//if(! $retval2 )//{// die('Could not get data: ' . mysql_error());//}//$record_count = mysql_num_rows($retval2);//$counter = 0;//while ($row2 = mysql_fetch_row($retval2))//{// print "['".$row2[0]."',".$row2[1];// if (++$counter == $record_count){// print "]\n";// } else {// print "],\n";// }//}?><!-- ]);// Create and draw the visualization.new google.visualization.LineChart(document.getElementById('line_chart')).draw(data, {curveType: "function",width: 500, height: 300,hAxis: {format: 'y/m/d'},vAxis: {maxValue: 5},title: 'Last 3 Days - VOLTS',legend: { position: 'right' }});}google.setOnLoadCallback(drawVisualization2);</script>--><script type="text/javascript">function drawItems() {var date_range = document.getElementById("date_range").value;var y_axis = document.getElementById("y_axis").value;var jsonChartData = $.ajax({url: "getchartdata.php",data: "time_slice="+date_range+"&y_axis="+y_axis,dataType:"json",async: false}).responseText;if ((y_axis == "ambient_temp")) {y_axis_title = "AMBIENT TEMP (degrees F)";}else {y_axis_title = "LUX (lumens)";}if (date_range >24) {date_range_title = (date_range/24)+' Days';}else {date_range_title = date_range+' Hours';}// Create the data table out of JSON data loaded from server.var chartdata = new google.visualization.DataTable(jsonChartData);var options = {vAxes: {0: {title: 'VOLTS'},1: {title: y_axis_title}},hAxis: {format: 'y/m/d'},series: {0: { type: "bars", targetAxisIndex: 0},1: { type: "line", targetAxisIndex: 1}},title: 'Last '+date_range_title+' - VOLTS & '+y_axis_title,legend: { position: 'bottom' },height: 500}// Create and draw the visualization.new google.visualization.ComboChart(document.getElementById('chart_div')).draw(chartdata,options);}google.setOnLoadCallback(drawItems);</script></head><body style="font-family: Arial;border: 0 none;"><div id="container"><div id="gauge" style="width: 300px; height: 300px;" align="center"></div><div id="gauge2" style="width: 300px; height: 300px;" align="center"></div><div id="gauge3" style="width: 300px; height: 300px;" align="center"></div><!-- <div id="line_chart" style="width: 500px; height: 300px;" align="center"></div> --></div><div id="graph_form"><HR><H3><center>Historical Performance View</H3><form action="">Time Slice For Graph:<select id='date_range' onchange='drawItems()'><option value='1'>Last Hour</option><option value='3'>Last 3 Hours</option><option value='6'>Last 6 Hours</option><option value='12'>Last 12 Hours</option><option value='24'>Last 24 Hours</option><option value='72'>Last 3 Days</option><option value='240'>Last 10 Days</option><option value='480'>Last 20 Days</option><option selected value='720'>Last 30 Days</option></select><BR> Secondary Y-Axis Value:<select id='y_axis' onchange='drawItems()'><option value='ambient_temp'>Ambient Temp</option><option value='lux'>Lux</option></select></form></div><div id="chart_div" style="border: 2px outset blue;"></div><BR><center>©2014 JKB</center></body></html><?php mysql_close($conn); ?>There is a second piece of code that is called to query the database and return a JSON data set to the function that builds the combo bar-line graph. It looks like this:
12345678910111213141516171819202122232425262728293031323334353637<?php$time_slice=$_GET["time_slice"];$y_axis=$_GET["y_axis"];$dbuser="xxxx";$dbname="SOLAR_DATA";$dbpass="yyyyyy";$dbserver="localhost:3036";if ($time_slice < 24){$sql_query = "SELECT TIME(timestamp), volts, ambient_temp, lux, amps, wattsFROM PANEL_DATA WHERE HOUR(TIMEDIFF(NOW(),timestamp)) < ".$time_slice;}else{$sql_query = "SELECT timestamp, volts, ambient_temp, lux, amps, wattsFROM PANEL_DATA WHERE HOUR(TIMEDIFF(NOW(),timestamp)) < ".$time_slice;}$con = mysql_connect($dbserver,$dbuser,$dbpass);if (!$con){ die('Could not connect: ' . mysql_error()); }mysql_select_db($dbname, $con);$result = mysql_query($sql_query);echo "{ \"cols\": [ {\"id\":\"\",\"label\":\"Date\",\"pattern\":\"\",\"type\":\"string\"}, {\"id\":\"\",\"label\":\"volts\",\"pattern\":\"\",\"type\":\"number\"}, {\"id\":\"\",\"label\":\"amps\",\"pattern\":\"\",\"type\":\"number\"}, {\"id\":\"\",\"label\":\"watts\",\"pattern\":\"\",\"type\":\"number\"}, {\"id\":\"\",\"label\":\"". $y_axis ."\",\"pattern\":\"\",\"type\":\"number\"}], \"rows\": [ ";$total_rows = mysql_num_rows($result);$row_num = 0;while($row = mysql_fetch_array($result)){$row_num++;if ($row_num == $total_rows){echo "{\"c\":[{\"v\":\"" . $row['timestamp'] . "\",\"f\":null},{\"v\":\"" . $row['volts'] . "\",\"f\":null}, {\"v\":\"" . $row['amps'] . "\",\"f\":null}, {\"v\":\"" . $row['watts'] . "\",\"f\":null}, {\"v\":" . $row[$y_axis] . ",\"f\":null}]}";} else {echo "{\"c\":[{\"v\":\"" . $row['timestamp'] . "\",\"f\":null},{\"v\":\"" . $row['volts'] . "\",\"f\":null}, {\"v\":\"" . $row['amps'] . "\",\"f\":null}, {\"v\":\"" . $row['watts'] . "\",\"f\":null}, {\"v\":" . $row[$y_axis] . ",\"f\":null}]},";}}echo "]}";mysql_close($con);?> - Electronics: Now came the tricky part – cobbling
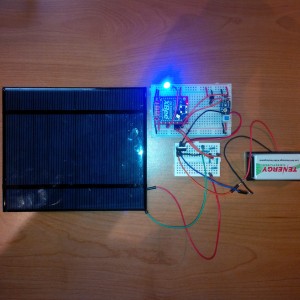
The initial prototype solar panel monitor cobbled together on my desk
the electronics together and writing the code to read the sensors and put the readings into the database. The database part was trivial but the electronics and code to read sensors were areas that I had zero experience with. As I started working on this (and getting more and more frustrated) the project took a fork in the road and I morphed it temporarily into the Garage Door Monitor Project which gave me a lot more experience for when I eventually got back to this part!
- Monitoring Code: The key to this was first understanding the equations and calculations needed to translate the readings coming over the XBEE into real data to put into the database. After a lot of digging around and reading I eventually got it figured out. The analog pins on the XBEE give readings that scale from 0 to 1023 so you can use that value to figure out a voltage reading and then plug it in to various equations for the sensors as follows:
- Voltage = (XBEE_PIN_READING /1023) * XBEE_REF_VOLTAGE
- Temperature:
- Temp_C = ( Voltage – 500 ) / 10
- Temp_F = (((Temp_C*9)/5)+32)
- Lux = (XBEE_PIN_READING /1023) * XBEE_REF_VOLTAGE
- Solar Panel Amps = (VOLTAGE_DROP_ACROSS_RESISTOR * VOLTS_PER_XBEE_ADC_POINT) / RESISTANCE
- Solar Panel Watts = SOLAR_PANEL_VOLTAGE * SOLAR_PANEL_AMPS
Python code for gathering the remote sensor readings via the XBEEs, converting them to useful data and then loading into the MySQL db:
123456789101112131415161718192021222324252627282930313233343536373839404142434445464748495051525354555657585960616263646566676869707172737475767778798081828384858687888990919293949596979899100101102103104105106107108109110111112113114115#!/usr/bin/pythonfrom xbee import XBeeimport serialimport timeimport MySQLdbimport randomfrom datetime import datetimeimport smtplib# Function for sending error messages...def SendErr(fromaddr, toaddr ,subj, body):msg = "From: %s\nTo: %s\nSubject: %s\n%s" % (fromaddr, toaddr, subj, body)# GMAIL auth credentials...username = 'xxxxx'password = 'yyyyy'# The actual mail sendserver = smtplib.SMTP('smtp.gmail.com:587')server.starttls()server.login(username,password)server.sendmail(fromaddr, toaddr, msg)server.quit()SERIALPORT = "/dev/ttyUSB0"BAUDRATE = 9600ser = serial.Serial(SERIALPORT, BAUDRATE)ser.open()xbee = XBee(ser)remote_addr="\x00\x13\xa2\x00\x40\xba\x3a\x41" # XBEE on RED Shieldxbee.remote_at(dest_addr_long=remote_addr,command='D0',parameter='\x02')xbee.remote_at(dest_addr_long=remote_addr,command='D1',parameter='\x02')xbee.remote_at(dest_addr_long=remote_addr,command='D2',parameter='\x02')xbee.remote_at(dest_addr_long=remote_addr,command='D3',parameter='\x02')while True:try:for x in range(0,2): # Take a couple of samples since the first one is sometimes bad...xbee.remote_at(dest_addr_long=remote_addr,command='IS', frame_id='A') #Sample the XBEE pin readings...response = xbee.wait_read_frame()time.sleep(1)samples = response['parameter']for each in samples:adc0 = float(each['adc-0'])adc1 = float(each['adc-1'])adc2 = float(each['adc-2'])adc3 = float(each['adc-3'])scaling_factor = 3500 # XBEE reference voltage...voltage = float(adc0*scaling_factor/1023)tempC = float((voltage-500)/10)tempF = float(((tempC*9)/5)+32)lux = float((adc1/1023)*scaling_factor)print '%s %6.2f %s %6.2f %s %5.2f %s %5.2f %s' %("adc-0:", adc0, "Voltage:", voltage, "adc-0 Temp Reading =", tempC, "C /", tempF, "F")print '%s %5.2f %s %5.2f' %("adc-1:", adc1, "Lux=", lux)print "\n\radc-2:", adc2, "adc-3:", adc3spanel_voltage = float((adc2/1023) * (scaling_factor-450)) / 1000print "\n\rSolar Panel Voltage =", spanel_voltage, "Volts"voltperadcpoint = .005spcurrent = float(((adc2-adc3) * voltperadcpoint)/10) # voltage drop across a 10 ohm resistor - each adc point equates to 0.005 volts per the multimeter...print "Solar Panel Current: (adc2 - adc3) * .005 volts per adc point / 10ohms resistance =", spcurrent, "Amps /", spcurrent/1000, "mAmps"spwatts = float(spanel_voltage * spcurrent)print "Solar Panel Watts: (voltage * current) =", spwatts, "W\n\r"# Write the data into the db...# Open database connectiondb = MySQLdb.connect("localhost","root","RoadBike1","SOLAR_DATA")# Prepare a cursor object using cursor() methodcursor = db.cursor()# Create a random value for volts until the sensor is working properly..spvolts = random.uniform(2,5)# Prepare SQL query to INSERT a record into the database.sql = """INSERT INTO PANEL_DATA(timestamp,volts,ambient_temp,lux,panel_angle,compass_dir)VALUES (CURRENT_TIMESTAMP,%s,%s,%s,%s,%s)"""try:# Execute the SQL commandcursor.execute(sql, (spvolts, tempF, lux, 45.3, 180))# Commit your changes in the databasedb.commit()print "\n\rData written to db...\n\r"except:# Rollback in case there is any errorprint "DB Error occurred..."db.rollback()# Disconnect from serverdb.close()# wait 15 mins (900 secs) so that we have 4 samples per hour...time.sleep(900)except (KeyboardInterrupt, SystemExit):breakexcept:SendErr('sender@yyyy.com', 'receiver@xxxx.com', 'Error Message from JKBPI', 'solar_monitor.py has failed...')print "\n\r\n\rSent error message email here as program died...\n\r"raiseser.close()

Key Challenges:
- I struggled a lot with getting consistent readings from the sensors and learned a bit about electronic “noise” that shows up when you have cheap parts and/or loose wiring in the system – After cleaning up the wiring and adding a few capacitors to smooth things out things have improved significantly. I’ve also started discarding the first reading as I sometimes see it flaky and assume there may be some timing issue or something when things first power up. The temp sensor will still occasionally flake out and give a reading that is off by + or – 40 degrees or so – I’m still wrestling with trying to figure out the cause for that.
- Figuring out the solar panel output also proved quite tricky. I’m a complete novice when it comes to circuits and electronics so the concept of measuring the voltage drop across a resistor was a bit foreign. Ohm’s law made perfect sense but the readings that I initially got never seemed to sync up with expectations and I spent a lot of time scratching my head.
Next steps:
- The breadboard is still a bit messy and things need to be cleaned up and packaged a bit more professionally – I might even try moving it on to a PCB board and trying to solder everything cleanly – maybe this will help to clear up some of the flaky readings
- Right now the database and web code are on my Raspberry Pi server and thus are only accessible on my private network. I don’t know if there’s any value in being able to get to it from the public internet but I might consider moving those pieces to my GoDaddy host.
- Once we have a few months of useful data then if it makes sense it will be time to engage a Solar Installation company and start getting some estimates!
Acknowledgements:
These web sites gave me some great insights:
- http://www.voltaicsystems.com/blog/wireless-monitoring-of-a-pv-solar-panel/
- http://www.element14.com/community/community/raspberry-pi/blog/2013/04/05/raspiwatt-discover-power-consumption-using-a-kill-a-watt-pi
- http://www.desert-home.com/p/test-html-code.html
And of course, thanks to Dad for inspiring me to try DIY projects like this and for teaching me that you can eventually figure out and fix anything if you just keep at it and use your noggin!